

Declining Price, Profits and Graphing
1.1 Application.
A clothing firm can manufacture suits at 20 dollars per suit. The initial cost
of the equipment is
10,000 dollars. The revenue was initially 80 dollars per suit, the selling
price. But, as more suits were
sold, the demand dropped. The retailer "noticed" a trend in the declining price:
for every additional suit
sold the price had to be dropped by about 5 cents (.05 dollars).
The objective is to find the break-even number of sales where revenue is equal
to cost. If the sales
are too small, the initial cost will make the total cost larger than the
revenue. In the other extreme, if the
sales are too large, the price per suit will be very small and the revenue will
be too small to realize a profit.
Also we would like to know the number of sales where the profit will be a
maximum.
1.2 Math Model.
The profit is defined to be the revenue minus the total costs
[profit] = [revenue] - [total cost]
P(x) = R(x) - C(x) where x is the number of suits sold.
The revenue is the price per suit times the number of suits sold, x. The price
per suit was initially 80 but
declined by .05 dollars for each additional suit sold. This means the price per
unit as a function of x, p(x)
is a straight line with vertical intercept equal to 80 and slope equal to -.05,
that is,
p(x) = -.05x + 80.
Thus, the revenue is
[revenue] = [price per suit] times [number of suits]
R(x) = p(x)x = (-.05x + 80)x.
The total cost for producing x suits is
[total cost] = [production cost of x suits] + [initial cost]
C(x) = 20x + 10,000.
Therefore, the profit as a function of the number of suits being sold is
P(x) = R(x) - C(x)
= (-.05x + 80)x - (20x + 10,000)
= -.05x2 + 60x - 10,000.
This is a mathematical model of the profit. We may use this model to determine
possible break-even
level of sales where P(x) = 0, and the level of sales where the profit will be a
maximum.
1.3 Methods of Solution.
The above profit function is a parabola which must open downward because the
coefficient of the
squared term is negative. If the total cost is not too large, the parabola will
have some parts above the
horizontal axis. The break-even sales of suits will be where the parabola
intersects the horizontal axis, and
the maximum profit is where the parabola peaks. We can find these three points
by three methods: (i)
calculate table of pairs (x,P(x)), (ii) graph the parabola, and (iii) complete
the square or use the quadratic
formula.
1.3.1 Table Method.
The values of P(x) for a variety of x can be computed by a number of tools. Here
we do this via
a spreadsheet and for x in increments of 100. Because we know the profit
function is a parabola, we can
infer from the table that the break-even points are x = 200 and x = 1000. So,
the retailer should configure
his/her shop to sell between 200 and 1000 suits. Moreover, from the table we see
that the profit is a
maximum of 8000 dollars if x = 600 suits are sold.
Table: Suits and Profit
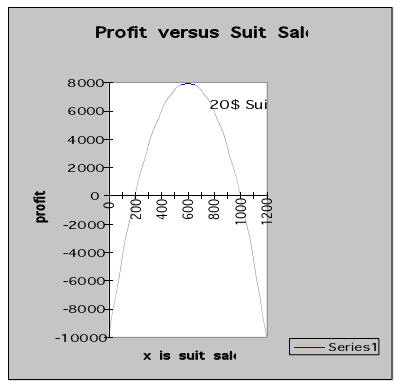
1.3.2 Graph Method.
The parabolic profit function can easily be graphed. This gives us a visual
interpretation of the
above table. For large tables of numbers this is much more convenient and may
yield additional
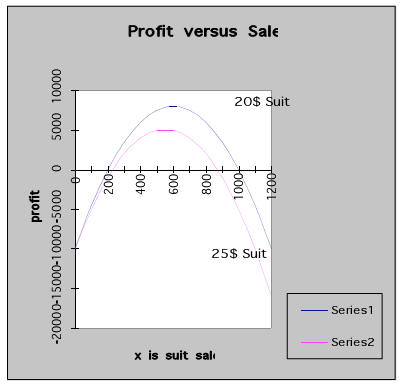
information. For example, suppose the cost of fabric or cost of labor increased
so that the cost of
producing one suit rose from 20 dollars to 25 dollars. Then the total cost and
the profit are
C(x) = 25x + 10,000 and
P(x) = R(x) - C(x)
= (-.05x + 80)x - (25x + 10,000)
= -.05x2 + 55x - 10,000.
Examination of the second graph with the two profit functions indicates that the
new break-even points are
about x = 220 and x = 880 and have moved closer. The new maximum profit is about
$5000 and will be
attained when x = 550. What will happen if the price per suit decreases from 20
to 15?
1.3.3 Algebra Method.
Both the table and graph methods give approximations of the solutions. A more
accurate method
involves completing the square or using the quadratic formula. Completing the
square makes use of the
formula

For the first profit function we have the following calculations
Let a = x and b = 600 to get

The break-even points are found by solving P(x) = 0

Thus.

The maximum profit can be obtained from

Here P(x) will be the largest possible when (x - 600)2 is the smallest, that is,
x = 600. In this case, the
maximum profit is P(600) = -1/20 ( 0 - 160,000) = 8,000. Another more general
method is to compute
the derivative of the profit function, set it equal to zero and solve for x:

The derivative method is particularly useful if the price function is not
linear.
1.3.3 Algebra Method, with Maple
Although taking derivatives of polynomials is not difficult, we can minimize our
effort by using a
computer algebra system like Maple. Better yet, Maple works with symbols, so it
rounds off only when we
tell it to do so. This means its solutions are generally more accurate than
working with a calculator.
After starting Maple, you should see a blank command prompt:
In this part of the lesson, we will learn how to define functions using
Maple. We will learn how
to take the derivatives of functions. We will then use the derivative to
maximize the profit.
To create a function in Maple, one uses the following format:
[> name := independent_variable -> formula ;
First let’s discuss the symbols used.
1. The assignment operator := tells Maple to associate the rest of the command
with
the object called name. The name must start with a letter, but after that first
letter
you can include numbers and the underscore character (_) if you like.
2. The functional operator -> tells Maple you are defining a function.
3. The semicolon ; tells Maple you have completed a command.
Using this information we can define the profit function for this assignment. We
will first define
the revenue function R, and the cost function C. We will then define the profit
function P as the differenc
between R(x) and C(x):
[>R:=x->(-0.05*x+80)*x;
When you type this into Maple and press the Return key, you will notice that
Maple repeats what you’ve
typed, except that the functional operator has now changed to an arrow:
R := x->(-.05 x + 80) x
This is Maple’s way of telling you it understood the command. If you get an
error instead, look carefully
at what you typed, find what you typed wrong, and try again.
Observe that we explicitly wrote the multiplication symbol. This is frequently
omitted in
mathematical writing, and Maple itself omits it when displaying the function –
but, as with Excel, you
will need to tell it when to multiply.
Now define the cost function:
[> C:=x->25*x+10000;
Observe that we did not type a comma to separate 10 from 000; that would confuse
Maple.
Finally define the revenue function. Because some older versions of Maple used
on campus do not
properly parse functions, we have to determine first what it should be, and only
then define it:
[> R(x)-C(x);
(-.05 x + 80) x – 25. x – 10000.
[> P:=x->(-.05*x+80)*x-25*x-10000;
P := x ->(-.05 x + 80) x – 25. x – 10000.
We can now evaluate the value of P at various points to
predict the profit at these points. Use the
same notation you would use in regular mathematics. To find the value of P when
x=10 units have been
sold, type:
[> P(10);
-9455.
So, the company would lose $9,455 if they only sold ten units. Similarly, to
find the value of P when
x=400 units have been sold, type:
[> P(400);
4000.
The company would earn $4,000 if they sold four hundred units.
Now let’s use Maple to help us maximize the profit. As we discussed earlier, we
maximize profit
by solving the equation P’(x)=0. In this course we will take derivatives using
the D() command. There is a
second command, diff(), but we will not study it.
D() accepts one argument, the function whose derivative you want. It returns a
function that
represents the derivative of the argument.
[> dP:=D(P);
dp := x -> -.10 x + 55
Now we have to find the number of items sold that maximize the profit. For this
we need to solve
the equation P’(x)=0. Since the variable dP represents the function P’, we can
do this very easily with
Maple’s solve() function:
[> solve(dP(x)=0);
550.
Please note: This is the value of x that maximizes the profit; it is not the
maximum profit! To find the
maximum profit, substitute this value into the profit function, typing exactly
what one would write in
algebra or calculus:
[> P(550);
5125.00
Hence the maximum profit is $5125. It occurs when 550
units are sold.
It may seem difficult, or annoying, to have to learn how to use Maple to do some
of these things
one could do by hand. However, as the functions become more complicated, Maple
will make your life
much, much easier.
1.4 Implementation.
Instructions for the Table:
Step 1. Open a spreadsheet and type in x in cell a1 and P(x) in cell b1.
Step 2. In cell a2 type in 0 and in cell b2 type in "=-.05*a2^2+60*a2-10000".
Step 3. In cell a3 type 100 and in cell b3 type in "=-.05*a3^2+60*a3-10000".
Step 4. Select cells a2:b3 and create a "series" by moving the cursor to the
lower right corner of cell b3 and "dragging" it down to cell b14.
Step 5. Examine the formulas in the cells b2:b14 and notice that a2 has been
incremented by one each move down column b2:b14.
Step 6. You should modify Steps 1-5 to do a table for the second profit
function for the 25$ suits.
Instructions for the Graph:
Step 1. Use the "chart wizard" and select the above cells a2:b14.
Step 2. Click the “chart wizard” button.
Step 3. Choose “scatter” chart.
Step 4. Follow the instructions.
Step 5. Experiment with other options, and the table from the profit
function for the 25$ suits.
Instructions for Maple:
Step 1. Define the revenue function R and the cost function C.
Step 2. Find the difference R(x)-C(x)
Step 3. Use that result to define the profit function P.
Step 4. Define dP, the derivative of P, using the D() function.
Step 5. Solve for the point of maximum profit using the solve() functi
Step 6. Find the maximum profit by evaluating P at that point.