End Behavior for linear and Quadratic Functions
1 End Behavior for linear and Quadratic Functions
A linear function like f(x) = 2x − 3 or a quadratic
function f(x) = x2 + 5x +3 are pretty generic. We have
the tools to determine what the graphs look like just by looking at the
functions. Today, I want to start
looking at more general aspects of these functions that carry through to the
more complicated polynomial
functions (e.g., f(x) = 2x4 − 3x3+ 7x2 − x + 11). Specifically, I want to look
at what the graphs look like
on the ends, what they look like near the x-axis, and distinguishing aspects of
the graph like bumps and
wiggles.
Let’s start with end behavior. We’ve seen this so far as the ends of the curves
we’ve drawn that point up or
down and signify that the functions run off to positive or negative infinity
(±∞). In particular, we want to
describe how the functions behave for very large values of x.
First, let’s look at the function f(x) = x2 + 5x + 3 at a somewhat large number,
like x = 1,000,000 for
example. We get
f(1,000,000) = (1,000,000)2 + 5(1,000,000) + 3.
If we look at each term separately, we get the numbers
1,000,000,000,000
5,000,000
3
Imagine graphing the point (1,000,000 , 1,000,005,000,003) (Good luck!). It
wouldn’t look much different
from (1,000,000 , 1,000,000,000,000).
We will say that x2 dominates x, when x is very large. Similarly, x dominates
any constant. Notice that
the same thing happens for large negative numbers like x = −1,000,000. Out
towards the ends of the graph,
therefore, f(x) = x2+5x+3 doesn’t look a whole lot different from f(x) = x2, and
when we’re just sketching
graphs, they don’t look different at all. Similarly, the function f(x) = 2x − 3
looks a lot like f(x) = 2x for
large values of x.
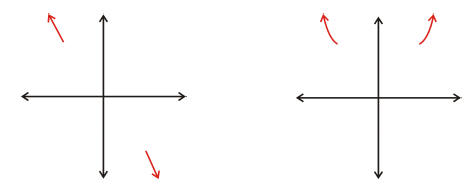
Figure 1:
As another example, consider the linear function f(x) = −3x+11. Since the x-term
dominates the constant
term, the end behavior is the same as the function f(x) = −3x. For large
positive values of x, f(x) is large
and negative, so the graph will point down on the right. Similarly, the graph
will point up on the left, as o
n the left of Figure 1.
On the other hand, if we have the function f(x) = x2+5x+3, this has the same end
behavior as f(x) = x2,
so the ends will go up on both sides, as on the right side of Figure ??. I’ve
given these a little curve upwards
to indicate that x2 gets bigger faster than x does.
1.1 Quiz 04-A
What is the end behavior of the following functions?
2 FACTORINGS OF QUADRATIC FUNCTIONS 2
1. f(x) = 2x − 4
2. f(x) = −x
3. f(x) = −2x2 + 11x + 4
2 Factorings of Quadratic Functions
I’m going to assume that you can factor quadratic expressions, at least in the
simpler cases. I want to focus
on what information we can draw from the factorings.
Given the quadratic function f(x) = x2 − 4x + 3, we can factor it as follows.
f(x) = (x − 1)(x − 3).
Since anything times zero is zero, we can see that if x = 1 or if x = 3, we get
f(1) = 0 and f(3) = 0. These
are the places where the graph crosses the x-axis, as can be seen in Figure 2.
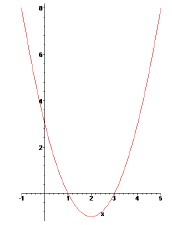
Figure 2:
For very large values of x (both positive and negative), the magnitude of x2 is
much larger than x, so it will
dominate to the right and left. The sign on the x2-term, therefore, determines
whether the parabola will
open upwards or downwards.
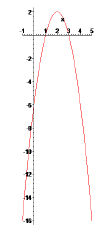
Figure 3:
For example, consider the function
g(x) = −2x2 + 8x − 6,
which is the first function multiplied by −2. It will open
downwards. In fact, we can factor as follows.
g(x) = −2x2 + 8x − 6 = −2(x2 − 4x + 3) = −2(x − 1)(x − 3).
The x-intercepts are the same, x = 1, 3, but now everything is multiplied by a
negative number, and that
turns things upside-down. Look at Figure 3. The 2 stretches everything
vertically, so the graph also looks
skinnier.
The basic factorings give us three possibilities. If we shift the function
function f up one unit, we get the
following.
h(x) = x2 − 4x + 4 = (x − 2)(x − 2).
Since both factors are the same, only x = 2 is an x-intercept. The x2-term is
positive, so the parabola opens
upwards. The graph must look as it does in Figure 4, therefore.
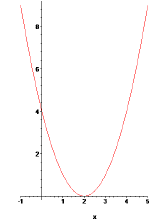
Figure 4:
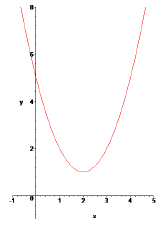
If we shift the function up any higher, it won’t intersect the x-axis at all.
This corresponds to the fact that
the function
j(x) = x2 − 4x + 5
does not factor over the real numbers. In fact, if we try to solve the equation
x2 − 4x + 5 = 0 using the
quadratic formula, we get

We have to use imaginery numbers to find square roots of
negative numbers. Anyway, the graph is shown
in Figure 5
We can also multiply by constants to stretch and compress the graphs vertically,
and multiplying by negative
numbers makes the parabolas open downwards.
2.1 Quiz 02-B (Note: We didn’t do this in class.)
Sketch the graphs of the following quadratic functions. For the answers, give
the x-intercepts and whether
the graph opens up or down.
QB1. f(x) = (x + 3)(x − 1).
QB2. f(x) = (x + 1)2. (The list of answers has been changed as of 1/17/05. The
correct answer should now
get credit in Blackboard.)
QB3. f(x) = x2 + 1. This does not factor over the reals, and the vertex is at x
= 0.
QB4. f(x) = −3(x + 3)(x − 1).
3 Homework 04
For each of the given functions, find the x-intercept(s) and the end behavior.
1. f(x) = x − 4.
2. f(x) = (x + 4)(x − 2).
3. f(x) = (x − 3)2.
4. f(x) = x2 + x + 1. This does not factor.
5. f(x) = 2(x − 3)(x − 5).
6. f(x) = −2(x + 1)(x + 1).
7. f(x) = −x2 − x − 1. Compare this to problem 4.


