How to Graphically Interpret the Complex Roots of a Quadratic Equation
As a secondary math teacher I have taught my students to
find the roots of a
quadratic equation in several ways. One of these ways is to graphically look at
the
quadratic and see were it crosses the x-axis. For example, the equation of y =
x2 – x – 2,
as shown in Figure 1, has roots at x = -1 and x = 2. These are the two places in
which the
sketched graph crosses the x-axis.
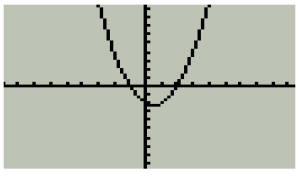
Figure 1
y = x2 – x – 2
The process of uses the quadratic formula will always find
the real roots of a
quadratic equation. We could have also used the quadratic formula to find the
roots of the
this equation, y = x2 – x – 2.

We can think of the first term (½) as a starting place for
finding the two roots.
Then we see that the roots are located 3/2 from the starting point in both
directions.
This leads us to roots of a quadratic equation that does
not cross the x-axis. These
roots are known as complex (imaginary) roots. An example of a quadratic drawn on
a
coordinate plane with complex roots is shown in Figure 3. Notice that the vertex
lies
above the x-axis, and the end behavior on both sides of the graph is approaching
positive
infinity. The complex roots to can be found by using the quadratic formula, but
it is
beneficial to students to visualize a graphical connection.
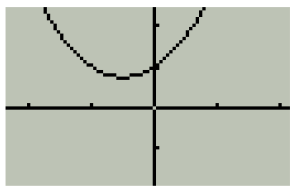
Figure 3
y = x2 + x + 1
GRAPHICAL INTERPRETATION OF COMPLEX ROOTS
We know that any quadratic can be represented by y = ax2 + bx + c. We also
know the roots of quadratic equations can be derived from the well-known
quadratic
formula:

If the roots are real we visually interpret them to cross the x-axis as shown in Figure 4a.
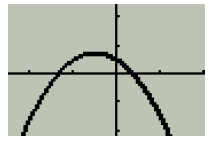
Figure 4a
y = −x2 − x + 1/2
But, we are interested in graphically interpreting the
roots of a graph that does not cross
the x-axis, as in Figure 4b.
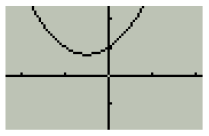
Figure 4b
y = x2 + x +1
Let’s use what we graphically know about quadratics with
real roots (Fig. 4a) to
explain what we don’t know graphically about quadratics with complex roots (Fig.
4b).
Now there are infinitely many quadratics with real roots and infinitely many
quadratics
with complex roots. But, when comparing one to another, it would be helpful if
the two
quadratics were related in some way.
If y = ax2 + bx + c produces real roots (bold line in
Figure 4c), a reflection of this
graph upward would yield a new quadratic equation that would produce complex
roots.
(See Figure 4c)
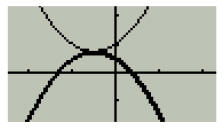
Figure 4c
To see how this is configured analytically, we will start
with the general equation
of a quadratic. (Remember: The quadratic that we are starting with (bold line)
is known
to have real roots.) First we complete the square. Then to create the flipped
quadratic
(which is a different equation), a negative is applied to a. Then I simplified
the equation
by multiplying.
y = ax2 + bx + c
--------------Complete the square----------------
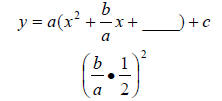
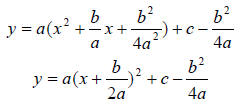
------------------Completed the square---------------
WE ARE CREATING A NEW QUADRATIC AT THIS POINT.
-------------------Reflect the Quadratic-------------

-------------------Reflected the Quadratic-------------
----------------------------Simplify------------------------
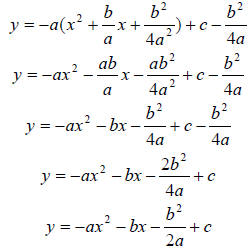
---------------------------Simplified------------------------
Now to be able to compare these complex roots to the real
roots that we started
with, plug the coefficients of the equation above into the quadratic formula.

-------------------------Simplify-----------------------
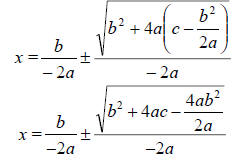
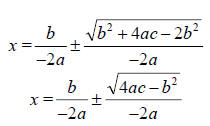
Because we are adding and subtracting from
 it is unnecessary to write the
negative in the second denominator.

-------------------------Simplified-----------------------
Since we know that we the roots are complex, we can show
that by extracting a
negative out of the radical.
Complex Roots of the Flipped Quadratic

Real Roots of the Quadratic We Started With

Notice that the real roots and the complex roots of
different quadratic equations
yielded very similar answers. They are actually the same except for the i in the
complex
roots.
The next step is to use figure out how to use these
similarities to find the complex
roots graphically. First, let’s review how to graph the complex number plane.
Horizontal
movement on the graph denotes the real part of the complex number, while
vertical
movement represents the imaginary part of the complex number. (See Figure 5)
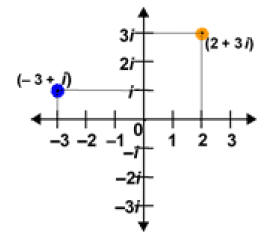
Figure 5
Now, working in three-space, imagine that these complex
coordinate plane is the
“floor”. It is represented by the (i, x) coordinate plane in Figure 6.
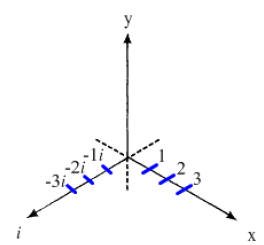
Figure 6
If we now use the (x,y) coordinate plane to draw a
quadratic with complex roots
we could get something that looks like Figure 7. Notice the quadratic does not
cross the
x-axis.
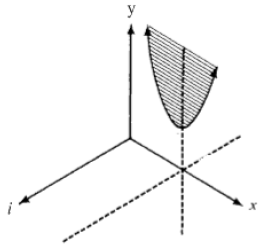
Figure 7
We currently can not see the complex roots graphically.
But if we flip the
quadratic horizontally over the vertex, from the proof about we should get roots
that
differ only by a number i. In order to graphically see the complex roots we need
to rotate
the reflected image 90 degrees to place the quadratic into the complex number
plane.
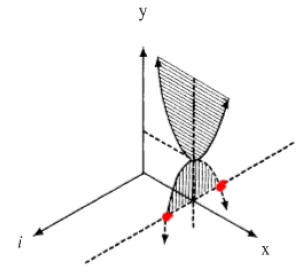
Figure 8
Notice that the two points indicated can be found by
starting at x units in
the real direction and i units in both the positive and negative direction. We
are
then able to graphically see the complex roots of a quadratic equation.
References
Weeks, Audrey. Connecting Complex Roots to a Parabola’s
Graph. June 20, 2007.
Vest, Floyd. The College Mathematics Journal, Vol. 16, No. 4. (Sep., 1985), pp.
257-
261.
